

- Make sure you’re on the Forms list page. For details on navigating there, see How to navigate to the Forms section.
- Only Published forms that have been shared with respondents will show actual numbers. Draft forms show 0 across all three columns.
- These columns are read-only and cannot be edited.
What each metric means
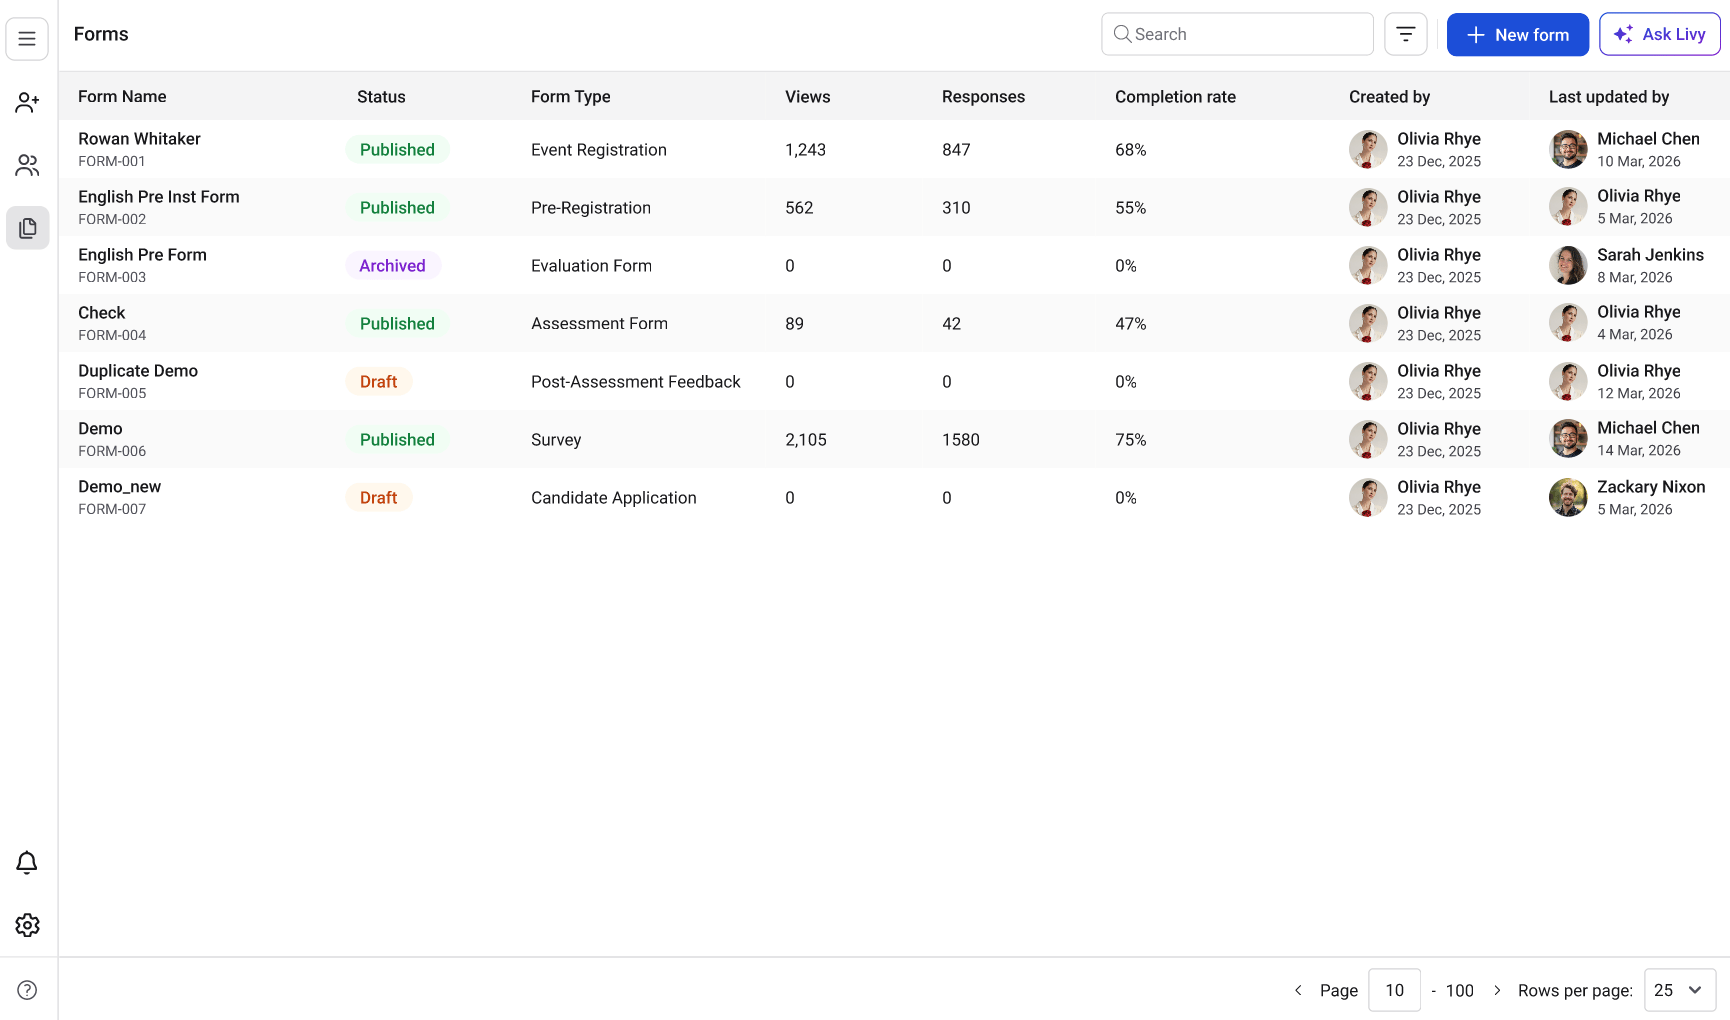
- Views - The number of times someone opened the form. Every time a respondent opens the form link, it counts as one view.
- Responses - The number of people who filled in and submitted the form.
- Completion rate - The percentage of people who submitted the form out of everyone who opened it. For example, if 100 people opened the form and 75 submitted it, the completion rate is 75%.
How these metrics are connected
Every time someone opens your form link, the Views count goes up by one. If they fill in the form and click Submit, the Responses count goes up by one. Completion rate is then calculated automatically based on the ratio of Responses to Views.How to use these metrics
- Compare Views and Responses to understand how many people are opening your form versus completing it.
- A low Completion rate may mean the form is too long or has too many required fields.
- Use these numbers to decide which forms need changes and which are performing well.